- Cost is defined by Route: Shipping costs and speeds are determined by the route’s popularity. Established lanes offer the best rates and service due to high carrier competition and efficiency.
- Snowbirds Spike Volatility: Routes connecting the Northeast/Midwest to Florida (for example, Miami/NYC, Florida/Chicago) see extreme price and demand spikes during seasonal “Snowbird” migrations.
- Stable Economic Corridors: Routes like California/Texas and Dallas/Chicago offer stable, good pricing year-round, fueled by corporate, manufacturing, and auction volume, rather than seasonal weather changes.
- The Remote Penalty: Shipping to or from remote locations incurs a significant cost premium and causes longer wait times, as carriers must charge for costly “deadhead miles.”
- Optimize with Strategy: Customers can reduce costs by leveraging high-demand lanes, utilizing carriers’ Tri-Haul strategies to fill empty miles, and timing their shipments for the slower, off-peak seasons.
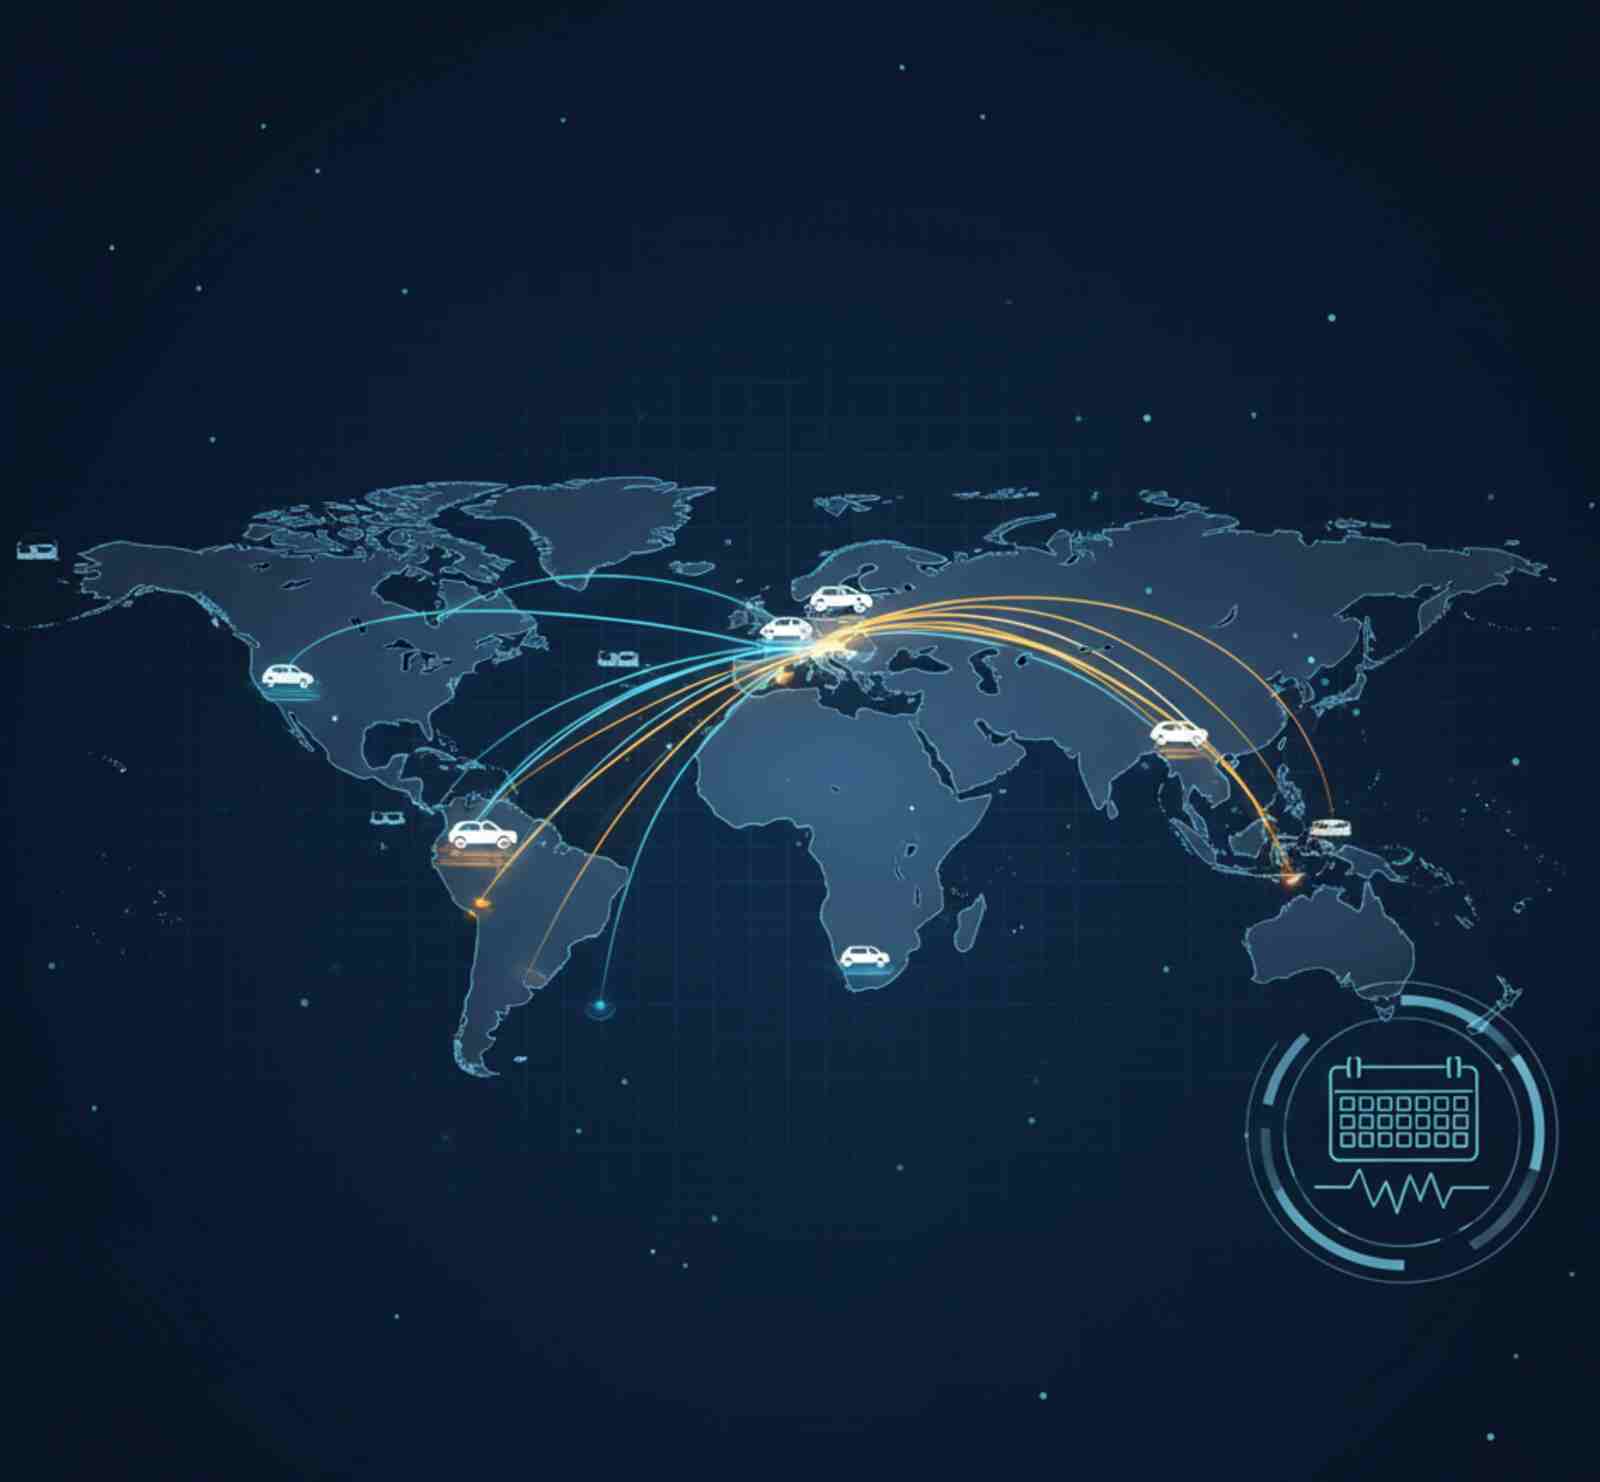
In the Auto Transport industry, knowing the most popular auto transport routes is a crucial factor that affects customer experience and dictates everything from cost to delivery speed.
Car shipping routes are not only trivial paths; they are the highways of the logistics world, connecting major cities and, in some cases, remote locations.
Established, busy lanes guarantee consistent carrier availability and, as volume usually means competition, this, in turn, translates directly into the best rates and fastest transit times for customers.
In this article, we will share with you the 10 most active lanes in the auto transport industry in 2026.
Top 10 Most Active U.S. Car Shipping Routes (2026)
As we explained above, active lanes are where you’ll find the most frequent carrier traffic, leading to better price competition and faster delivery times.
Based on industry data tracking, here are the top 10 most Active U.S. car shipping routes for 2026:
California — Texas
The popularity of this route has continued due to ongoing relocation trends and business expansion into Texas job centers.
This consistent outbound traffic from California guarantees carriers frequently travel east with full loads.
| Avg. Miles | Avg. Cost | Seasonality |
| 1,400–1,600 | $1,050 – $1,350 | Stable (High Year-Round) |
Miami, FL — New York, NY
Seasonal “Snowbird” relocation patterns remain strong in 2026, with spikes during winter southbound travel and spring northbound returns. Prices spike dramatically in December and January (Southbound) and April and May (Northbound.)
As the weather in the Northeast turns cold, thousands of people ship their vehicles south to Florida, where they spend the winter months.
On the contrary, when the weather warms up in the spring, the migration reverses. People ship their vehicles back north to their primary homes.
| Avg. Miles | Avg. Cost | Seasonality |
| 1,250 – 1,400 | $1,150 – $1,600 | Extreme Volatility |
Los Angeles, CA — New York, NY
This is the primary transcontinental route, connecting the two largest economic locations. Commonly, you can get a lower cost-per-mile due to high distance efficiency.
Its consistent high volume is sustained not only by corporate and personal relocations but also by the constant need to move new vehicle inventory between the major ports.
| Avg. Miles | Avg. Cost | Seasonality |
| 2,800 – 3,000 | $1,400 – $1,800 | Stable (Lower Cost/Mile) |
Florida — Chicago, IL
The heavy demand of this route is driven by retirees and vacationers from the Midwest escaping winter cold and returning in the spring.
This corridor is essentially the Midwest’s version of the “Snowbird” rush.
Starting in late October and peaking in November and December, vehicles flood southbound lanes due to residents fleeing the harsh Midwest winters for the warmer climate of Florida.
The reverse migration happens in April and May, with cars heading north back to Illinois and other states like Michigan and Wisconsin.
| Avg. Miles | Avg. Cost | Seasonality |
| 1,200 – 1,350 | $1,100 – $1,500 | High Volatility |
Dallas, TX — Chicago, IL
This lane connects logistics, auction, and corporate cities. It is a busy north-south route that usually offers good rates.
The Dallas-Chicago route is defined by stable, year-round commercial activity, as it links two distribution centers of the Texas economy (Dallas and Houston) with manufacturing and auction markets centered on Chicago.
| Avg. Miles | Avg. Cost | Seasonality |
| 900 – 1,050 | $850 – $1,150 | High (Corporate/Auction) |
Atlanta, GA — Washington, D.C.
This corridor has been seeing consistent volume from military, government, and corporate relocations.
The demand between these two areas is commonly steady and less prone to the extreme seasonal swings of the Snowbird auto transport routes.
| Avg. Miles | Avg. Cost | Seasonality |
| 600 – 650 | $650 – $850 | High (Traffic) |
San Francisco, CA — Seattle, WA
This route, which connects major technology and commerce centers, often sees high volumes of enclosed transport, as this is the key corridor linking the Pacific Northwest’s tech hubs with California’s Silicon Valley and Bay Area.
| Avg. Miles | Avg. Cost | Seasonality |
| 800 – 950 | $750 – $1,000 | High (Tech/Commerce) |
California — Arizona
Connects two major cities with a consistent flow for snowbirds, students, and car auction buyers. It has a higher cost-per-mile, which is typical of shorter trips.
The high volume of students moving to and from major universities in both states contributes significantly to traffic at the beginning and end of college semesters.
| Avg. Miles | Avg. Cost | Seasonality |
| 350 – 500 | $550 – $750 | High (Higher Cost/Mile) |
Chicago, IL — Los Angeles, CA
A major long-haul route connecting a Midwest major manufacturing city to the massive West Coast market.
This corridor represents a crucial lane for the American supply chain.
| Avg. Miles | Avg. Cost | Seasonality |
| 2,000 – 2,200 | $1,200 – $1,500 | Stable (Cross-Country) |
Seattle, WA — Phoenix, AZ
This lane is mainly populated by those who escape from the cloudy, high-cost Pacific Northwest to the warmer, drier, and sometimes more affordable Southwest.
Volume spikes in the fall (Southbound) and spring (Northbound).
| Avg. Miles | Avg. Cost | Seasonality |
| 1,400 – 1,600 | $1,150 – $1,450 | High Volatility |
How Demand Affects Cost In The Auto Transport Industry
Auto transport functions just as any other industry. The cost of car shipping is a direct reflection of the basic economic principle of supply and demand, as it relates to carrier availability.
Supply is the number of available transport trucks ready to move vehicles on a specific route, and Demand is the number of vehicles that need to be shipped on that same route.
Here is a breakdown of how the balance between these two factors directly affects both carrier availability and the resulting price you pay:
When there’s a high demand, meaning there are significantly more vehicles needing transport than there are spots on available carriers, the price tends to be higher. This tends to occur during summer relocations, or the Snowbird rush south in the fall.
On the other hand, when there are fewer vehicles needing transport than there are available spots on carriers, which usually occurs during mid-winter or the late fall shoulder season — excluding snowbird routes — prices are lower.
Route Planning Tips to Reduce Empty Miles
- Tri-Haul Strategy: Instead of a simple round-trip — A to B, then B to A empty — carriers look for a Tri-Haul or continuous loop that keeps the trailer full, turning a potentially empty leg into a paid one.
- Leverage Digital Load Matching Platforms: Carriers use real-time digital load boards and Transportation Management Systems to monitor available loads near their truck’s drop-off point, helping them find an immediate pickup within a radius of the delivery location, ensuring the truck is not driving empty for long.
- Focus on Freight Zones, Not Single Lanes: Instead of only running one specific lane, smart carriers plan around high-demand regions, getting them into a zone known for frequent, high-paying outbound freight. So, even if the current load’s rate is slightly lower, they are confident they will secure a good-paying load for the next leg.
- Use Short “Filler” Loads to Close Gaps: If the next high-paying load is 200 miles away, a carrier will look for a short-haul load — a filler — that pays enough to cover the fuel and time for the first 100 miles.
- Build Strong Broker/Shipper Relationships: Established relationships provide more reliable, consistent opportunities and loop routes, allowing the carrier to secure their entire week’s schedule with paying loads in advance.
Plan Better Loads With Smart Route Insights
Tessa, our AI-powered, intelligent assistant, has the capacity to calculate auto transport routes efficiently, analyze high-demand peaks, seasonal shipping waves, and strategically match loads to suitable carriers, minimizing empty miles.
Ready to move beyond guesswork and ship your car with the best carrier available on haulin.ai?